User Guide
Texas Load Zone Application
September 29, 2011
Overview | Map Interface |
Map Navigation | Map Display Controls
(Roads View) (Aerial View) |
Map Legend | Application Controls
(Map Home) (Measurement Tool)
(Query) (Help) (Interactive Tree)
(Interactive Table) (Export) |
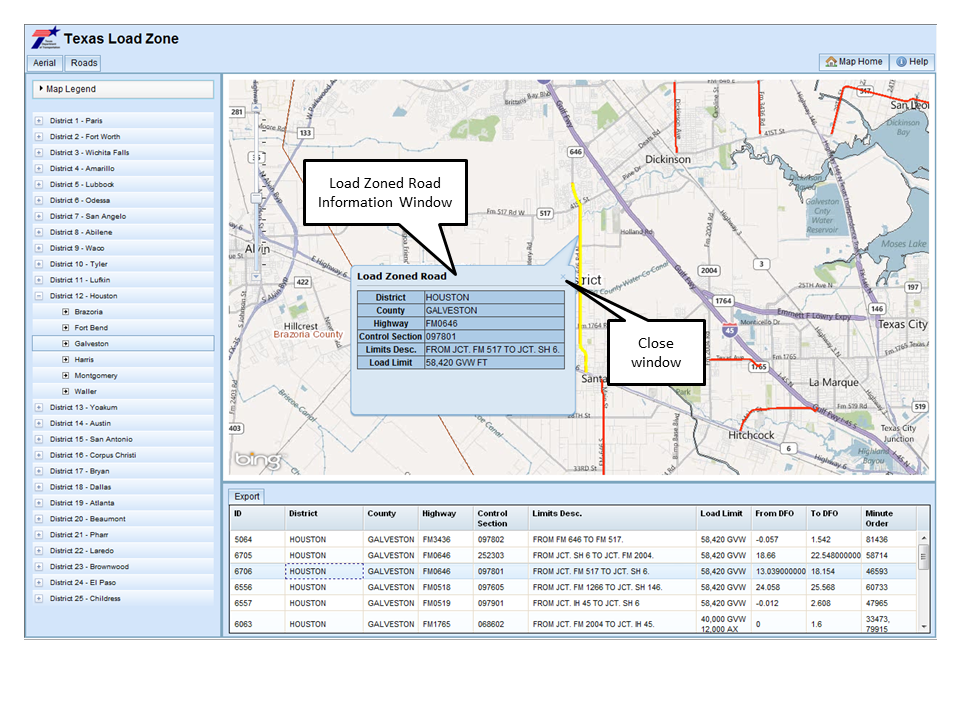
Feature Identification
(Load Zone Road Information)
This help document refers to the Texas Load Zone application.
This application is a graphical representation of pavement load limit data.
Please note that this application comes with some limitations. The data for
the application is taken to be suitable for planning and general mapping
purposes. The base map data is hosted by Microsoft, independent of TxDOT,
so TxDOT has no control as to the content or accuracy of the data. This
application was developed and is maintained by the Technology Services Division
(TSD).
(top)
(top)
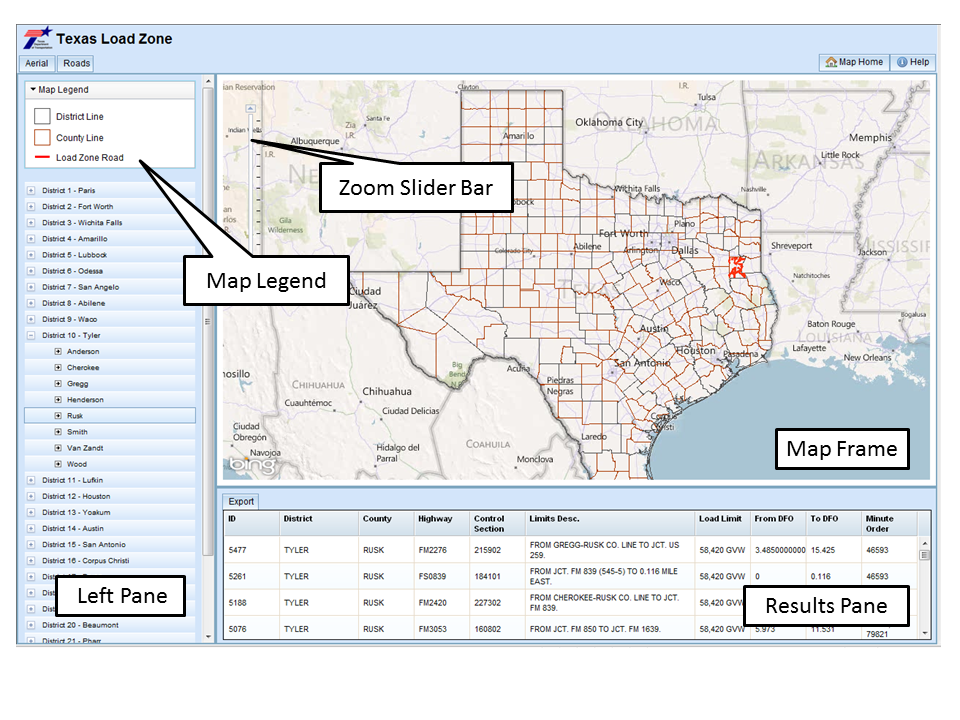
Panning navigation within the map can be controlled with the mouse.
The user can left click the mouse pointer, hold the button down and drag the map
around the screen to pan the map. The map can be zoomed in and out with the mouse
wheel if it is present, or by double clicking on the mouse pointer within the map
frame. The user can also use the zoom slider bar within the map frame to move the
map in and out.
(top)
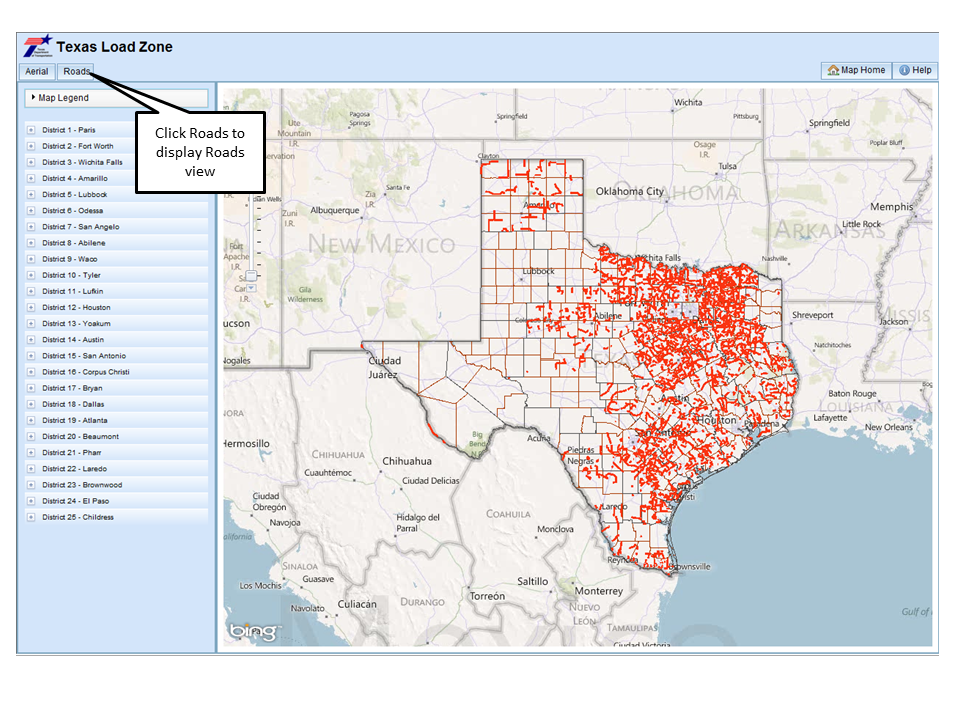
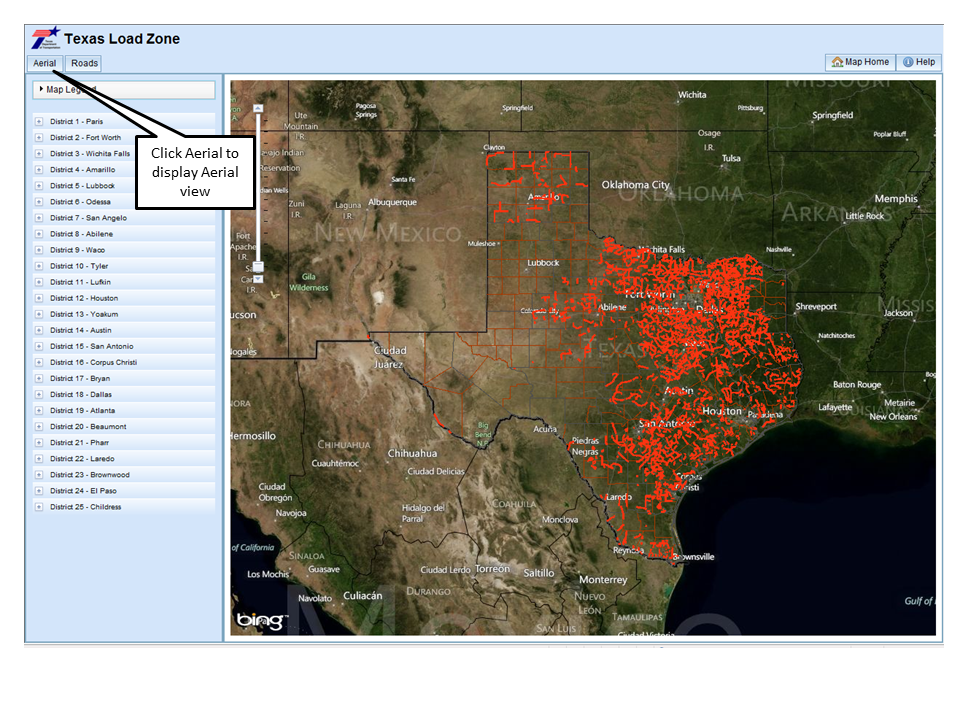
Basemap
The Bing™ Road basemap is displayed by default. The
user has the ability to change the basemap display by clicking on either the
Roads or Aerial button.
(top)
(top)
(top)
The Map Legend displays the Texas District boundary lines, the Texas County boundary lines, and Load Zoned roads.
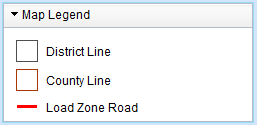
Note: The map legend can be expanded or reduced by
clicking on the Map Legend title.
(top)
The application has a series of controls available to the user as
a method to filter the data, and tools to use the site.

Note: Located at the top right of the screen.
(top)
The Map Home button can be clicked to immediately zoom the user back
to the extent of Texas and reset the application without having to reload the page.
(top)
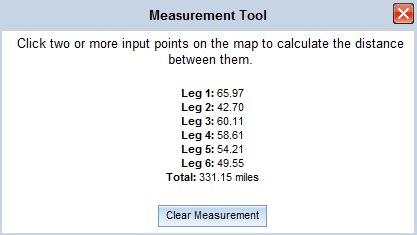
The measurement tool calculates the distance between two or more clicked
points. To enable the measurement tool, click on the Measurement Tool button. While the
measurement tool is enabled, other features such as querying and identifying features will
be disabled. Pan or zoom in to the location where you want to measure distances. Click on
the map two or more times, and the measurement tool will update the distance between each leg,
along with a total distance from the first to the last click. To clear and restart measuring,
click on the Clear Measurement button. To exit and disable the measurement tool, click on the
X in the top right corner of the measurement tool window.
(top)
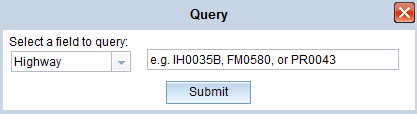
You can query the application for load zoned roads by using the Query feature.
Click on the Query button to enable the query feature. From the drop down list, select one of
the fields available to query by. Enter the value you want to query, and click the Submit button.
The results of the query will be displayed in the interactive table in the results pane.
To exit the query feature, click on the X in the top right corner of the query window.
(top)
The Help button can be clicked at anytime to open the help document
related to this site.
(top)
Note: Located in the Left Pane.
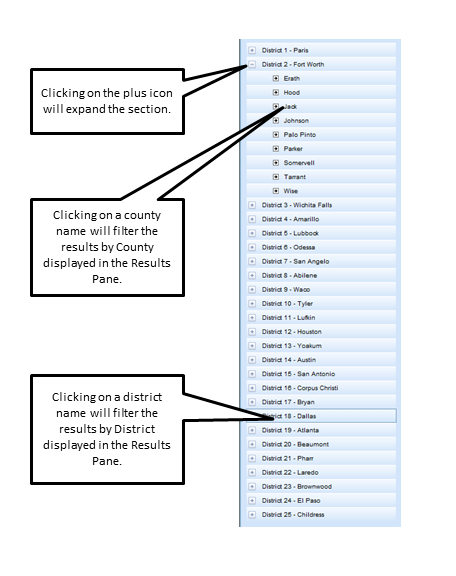
The left pane has an interactive tree that can be used to filter
the load zone roads in a district or county. The tree lists all the 25 districts.
Clicking on the plus icon next to the district will expand and list the counties
for that district. Clicking on either the district name or the county name will
filter the roads for that district/county. The filtered roads will display in the
results pane. Additionally, the map frame will zoom in to the selected district
or county extent.
(top)
Note: Located in the Results Pane.
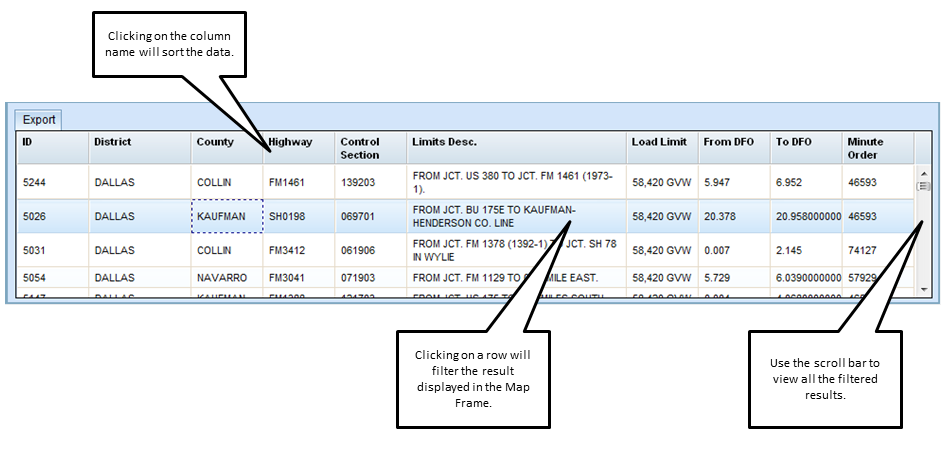
The results pane displays an interactive table of results when
either the district or county name is used to filter results. The data can be
sorted in ascending or descending order by clicking on each of the column names.
Clicking on a row will cause the map frame to zoom in to the extent of the
selected road, highlighting it in yellow.
(top)

Note: Located in the top left corner of the Results Pane.
The Export button can be used to export the data from the table
to a format that can be either opened or saved using Microsoft Excel.
(top)
The user can click on a load zoned road in the map frame to identify that
feature and get a subset of the tabular information.
(top)
(top)
Note: To add the Load Zoned Roads data to an ArcMap project, go to the TARHE database.
You will find the Load Zoned Roads data under TXDOT_ROUTES.PAVEMENT. The feature class is named
TX_LOADZONE_PRJ_LN. If you need help with connecting to TARHE or other GIS instructional information,
please refer to the GIS SharePoint site.
(top)